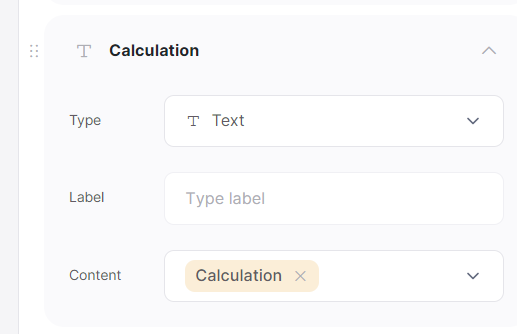
I have a chart.js chart rendered on pages like this, where the javascript string is in the description column. I want to use the new block but the chart doesn’t render.
Both are using the same field with this text in it:
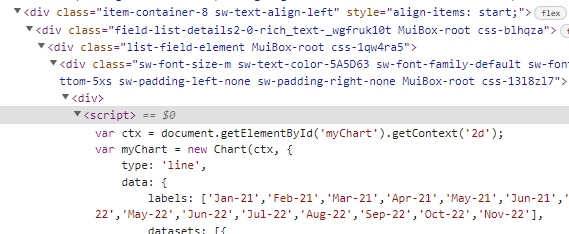
<script>var ctx = document.getElementById('myChart').getContext('2d');
var myChart = new Chart(ctx, {
    type: 'line',
    data: {
        labels: ['Feb-22','Mar-22','Apr-22','May-22','Jun-22','Jul-22','Aug-22','Sep-22','Oct-22','Nov-22'],
        datasets: [{
            label: 'Studio',
            data: [1665.0,1508.0,1665.0,NaN,1653.0,1710.0,1675.0,1715.7,1732.3,1748.5],
            borderColor: ['rgba(246, 71, 71, 1)'],
            borderWidth: 3,
            fill:false,
            pointBackgroundColor:'rgba(255,255,255)',
            pointBorderColor:'rgba(246, 71, 71, 1)',
            pointHoverRadius:5,
            pointRadius:5
        },
        {
            label: 'One Bed',
            data: [2119.1,1902.4,1989.9,2070.9,2139.5,2125.8,2102.8,1906.9,1877.3,1788.5],
            borderColor: [ 'rgba(44, 130, 201, 1)'],
            borderWidth: 3,
            fill:false,
            pointBackgroundColor:'rgba(255,255,255)',
            pointBorderColor:'rgba(44, 130, 201, 1)',
            pointHoverRadius:5,
            pointRadius:5
        },       {
            label: 'Two Bed',
            data: [3526.4,2827.8,2816.8,3229.2,3264.0,2912.9,2934.0,2641.7,2817.4,2798.9],
            borderColor: ['rgba(0, 230, 64, 1)'],
            borderWidth: 3,
            fill:false,
            pointBackgroundColor:'rgba(255,255,255)',
            pointBorderColor:'rgba(0, 230, 64, 1)',
            pointHoverRadius:5,
            pointRadius:5
        },{
            label: 'Three Bed',
            data: [4350.0,3557.0,NaN,6565.0,6526.0,5795.0,5795.0,4166.0,NaN,4130.0 ],
            borderColor: ['rgba(255,140,0, 1)'],
            borderWidth: 3,
            fill:false,
            pointBackgroundColor:'rgba(255,255,255)',
            pointBorderColor:'rgba(255,140,0, 1)',
            pointHoverRadius:5,
            pointRadius:5
        },
 ]
    },
    options: {
 responsive:true,scales: {
            xAxes: [{
                ticks: {
                    suggestedMin:1000,
                    suggestedMax:2600
                }
            }]
        },
        title:{
            display:false,
            text:'Average Rent Price by Room Type'
        }
    }
});
</script>
Works:
Doesn’t Work:
https://rentsmartdenver.preview.softr.io/item-detail-copy?t=1669758391290
The script can be seen in the html on the doesn’t work version, but it doesn’t render the chart.