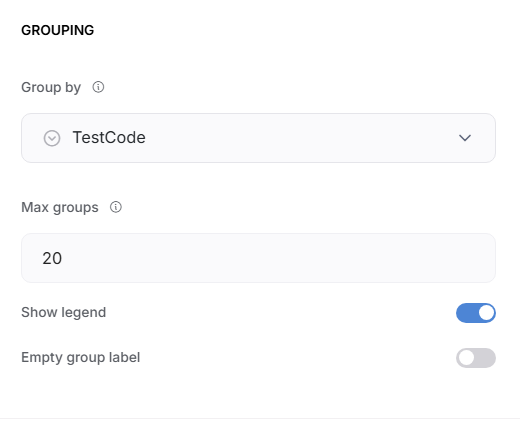
I realized that the “Metric” chart doesn’t have group by option which I need to count unique items. Can we get some assistance with that feature. It is already available in some of the other chart options. Below is a snip from “Pie Chart” options.
Hi @DoplerX,
This is indeed how the Metric chart is designed to work, it displays a single numeric value based on the Value field mapped to it and the aggregate function configured for that field.
You can apply a conditional filter to the block to display the metric value for a specific record.

Goodmorning Sveta!
My data has three variables “Active”, “Approved” and “Rejected” in the column that I want to use to display the metrics. My task is to display the total count for each of the variables and I can’t seem to figure that out. The column and bar charts are able to group by that column but I need metric chart to be able to do that for me as well. Is there a work around?