Data visualization tools (from Airtable)

Hi there!

Do you have any recommendation for data visualization to embed in Softr, pulling data from Airtable?

I tested Airtable view embed but is too complex for the end user and the customiaztion capabilities aren’t so good.

I want to create table views, pulling custom queries and allowing a proper filtering and sorting experience.

I also need charts capabilities offering filtering as well, Softr own charts are pretty limited in that sense.

I look fwd to your recommendations.

Thanks!

3 Likes

I’m interested in that as well :slight_smile:

Hi @asc570 @Tim_ClimatEU have you tried Looker studio? I think it is a really good option against other kind of solutions…but the point is doing it from info in sheets… I am trying to work with both databases at the same time

3 Likes

Hi @asc570, can you share key limitations that Table Block / Chart blocks are holding you back right now?

Hi!

I can’t select for example date grouping: Show data daily, weekly, monthly

I can’t filter based on specific attributes, for example: Show me only orders from customers on plan A, B or C.

I can’t set the timeframe for the entire shart, it only shows all time data.

GDS/lookg would be a good option but I don’t want to replicate airtable somewhere else.

I read about Draxlr but they don’t connect directly, they need to do some magic to plug Airtable

Thanks so much @asc570,
We do have time grouping, and filtering on our radar. I’ve captured your feedback.

Hi @Jakub , is there any updates on new filtering/grouping?

Ty!

Hi @asc570 , I don’t have any specific timelines yet, but yes – date grouping is near the top of our chart improvements to be done. Filtering is further down the line.

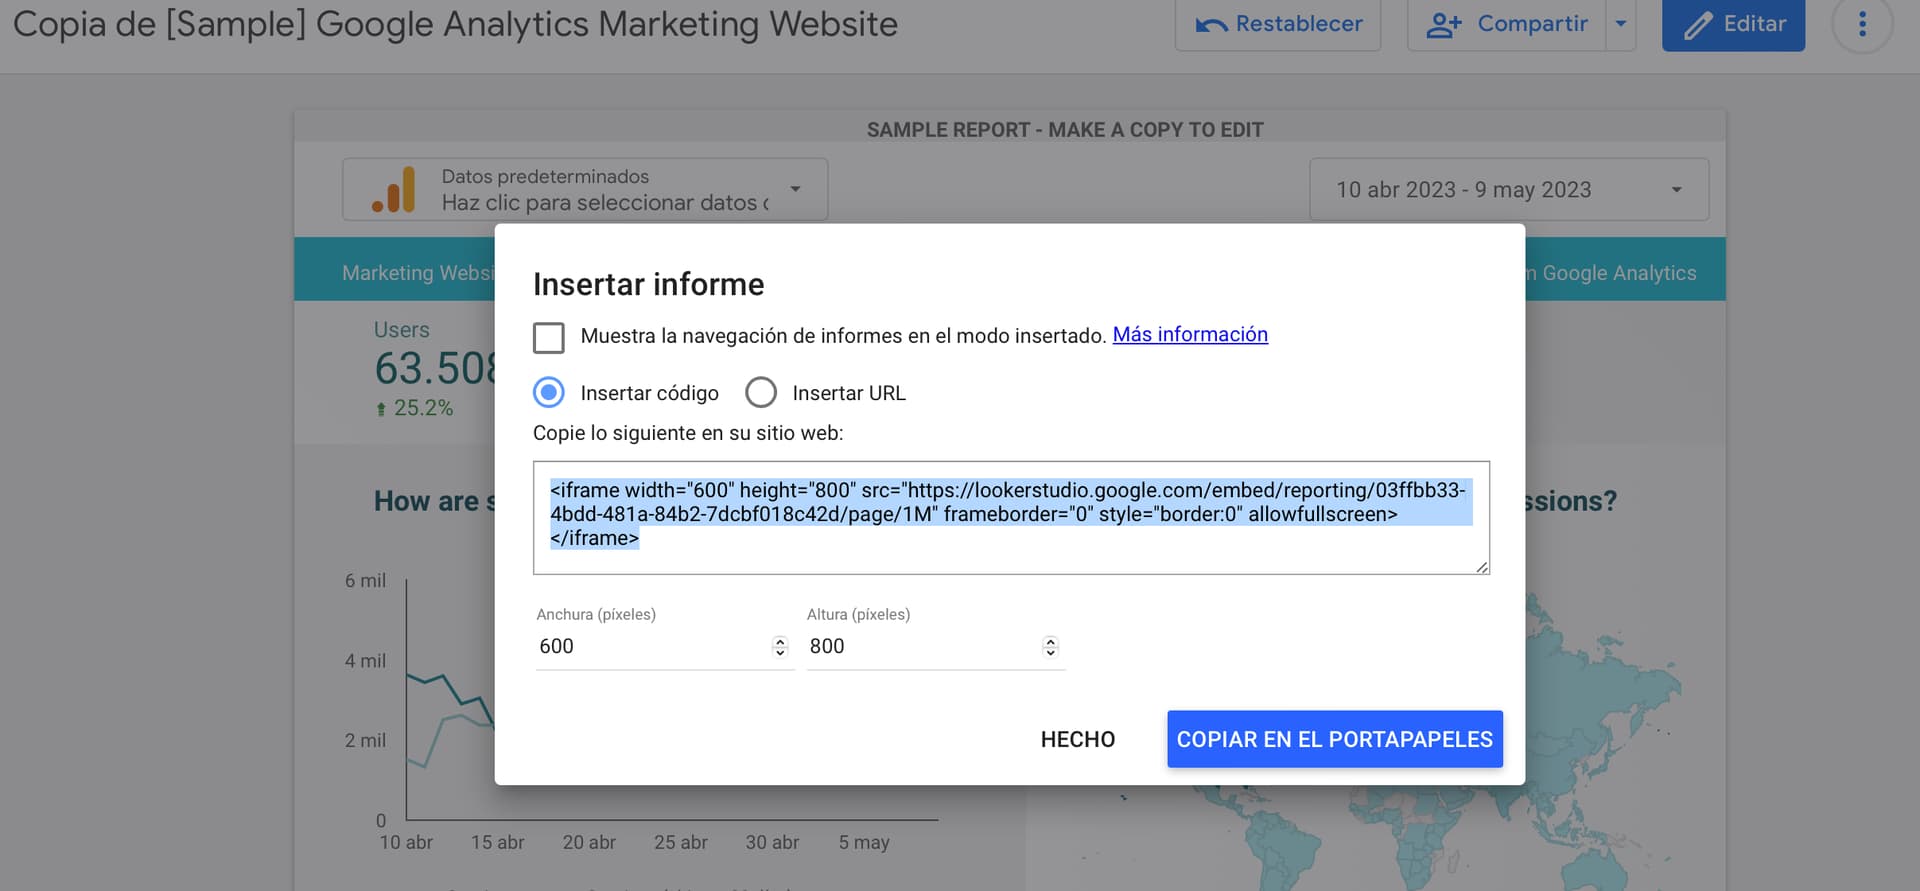
I use also use Google Looker/Data Studio. I also use a tool called Coupler.io to import full data between Airtable and Looker Studio (previously via Google Sheets, but I believe they have just launched a direct connector - may be worth trialling).