Hi all,
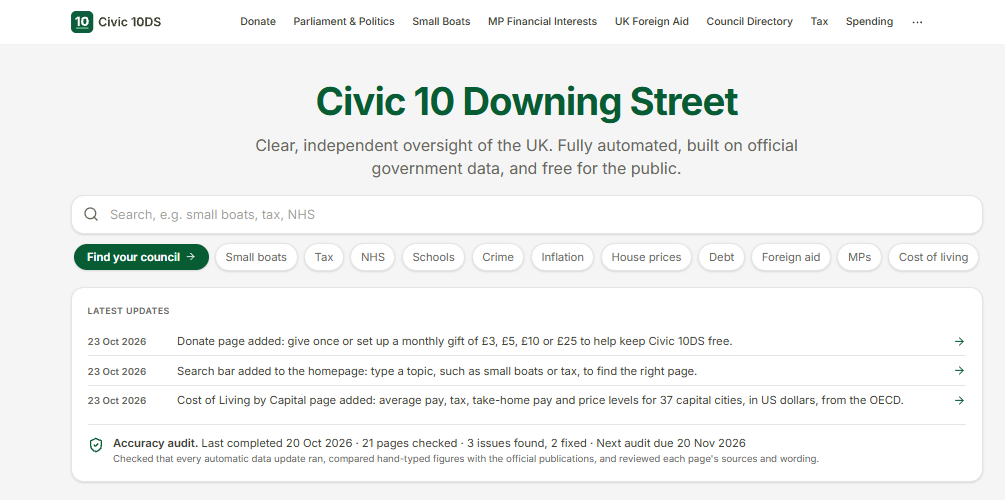
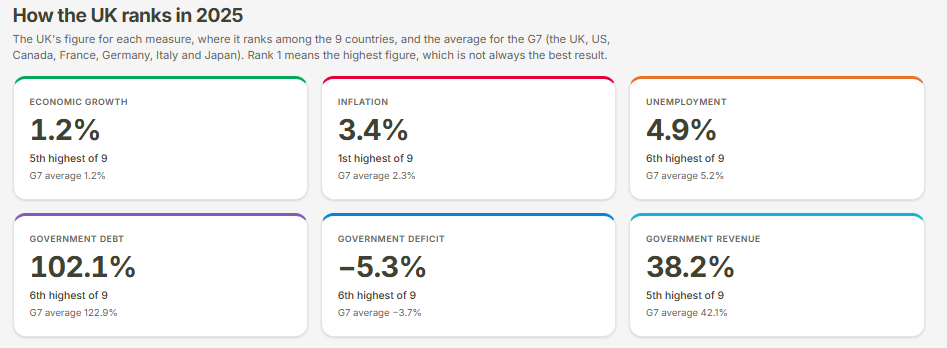
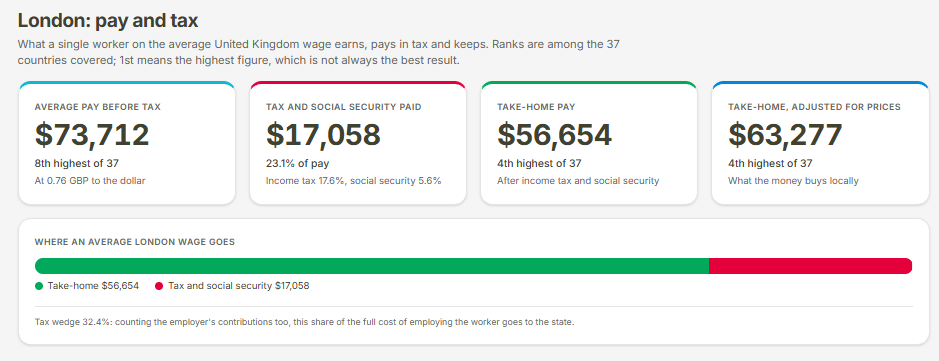
I’ve just launched Civic 10 Downing Street (civic10ds.co.uk), a free site that turns official UK statistics into clear, sourced dashboards: tax, NHS, schools, crime, councils, small boat crossings, how the UK compares with other countries, cost of living across 37 capital cities, and more.
How it’s built:
- Softr for the site, with Vibe Coding blocks for the custom charts, the homepage search and the donate page
- Google Sheets as the database, one tab per dataset - Apps Script on timers that pull from ONS, HMRC, NHS England, the Home Office, the OECD and others, with sanity checks so a bad download never overwrites good data
- Stripe Payment Links for optional monthly or one-off donation
Things that worked well:
- Vibe Coding blocks reading straight from Google Sheets tabs, so the site updates itself
- A Site_Search tab that powers the homepage search bar
- Checking every page on a phone-sized screen before publishing
Every figure names its source, and I’d love feedback on how it looks and reads, especially on mobile. Anything confusing, missing or broken, please tell me.