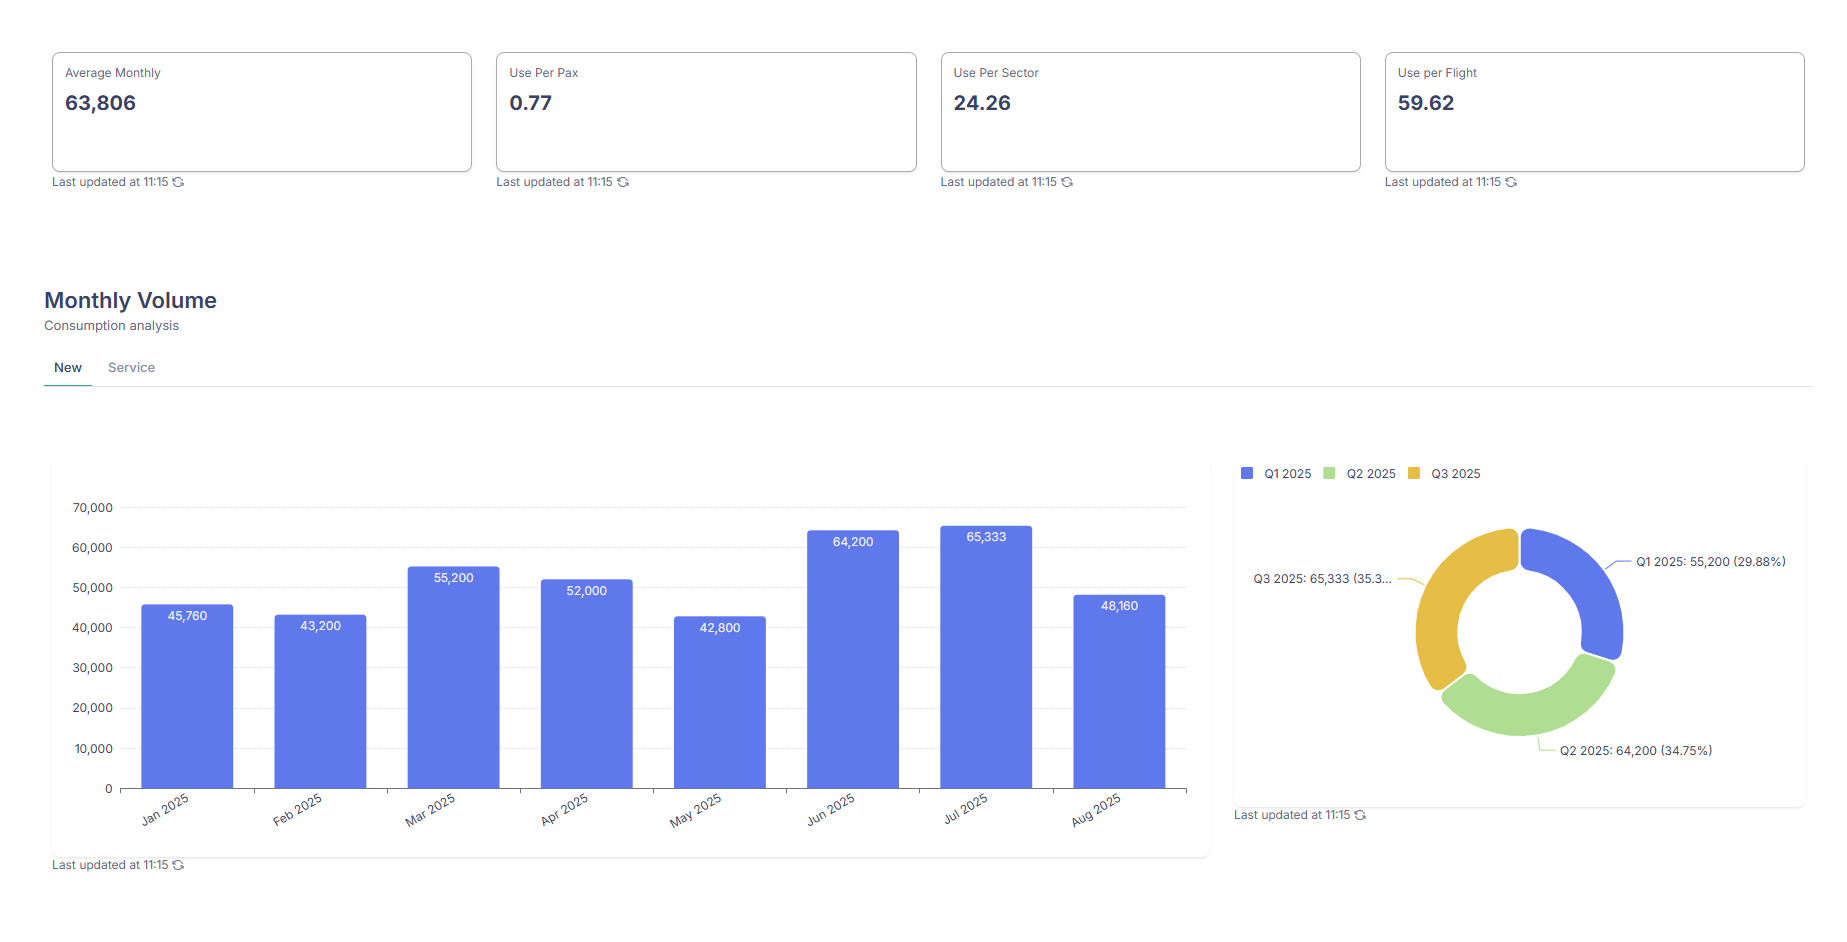
I’ve started to use the charts a bit more within SOFTR, and one thing that would be great is the ability to add a second data source (like a target line), and also trend, average lines etc…. The Analytics are very clean, but I think they would be alot more functional with a few more analytical modelling capabilities. ![]()
1 Like
@Jjenglert - I understand charts are being looked at. Is this a consideration for future roadmap?
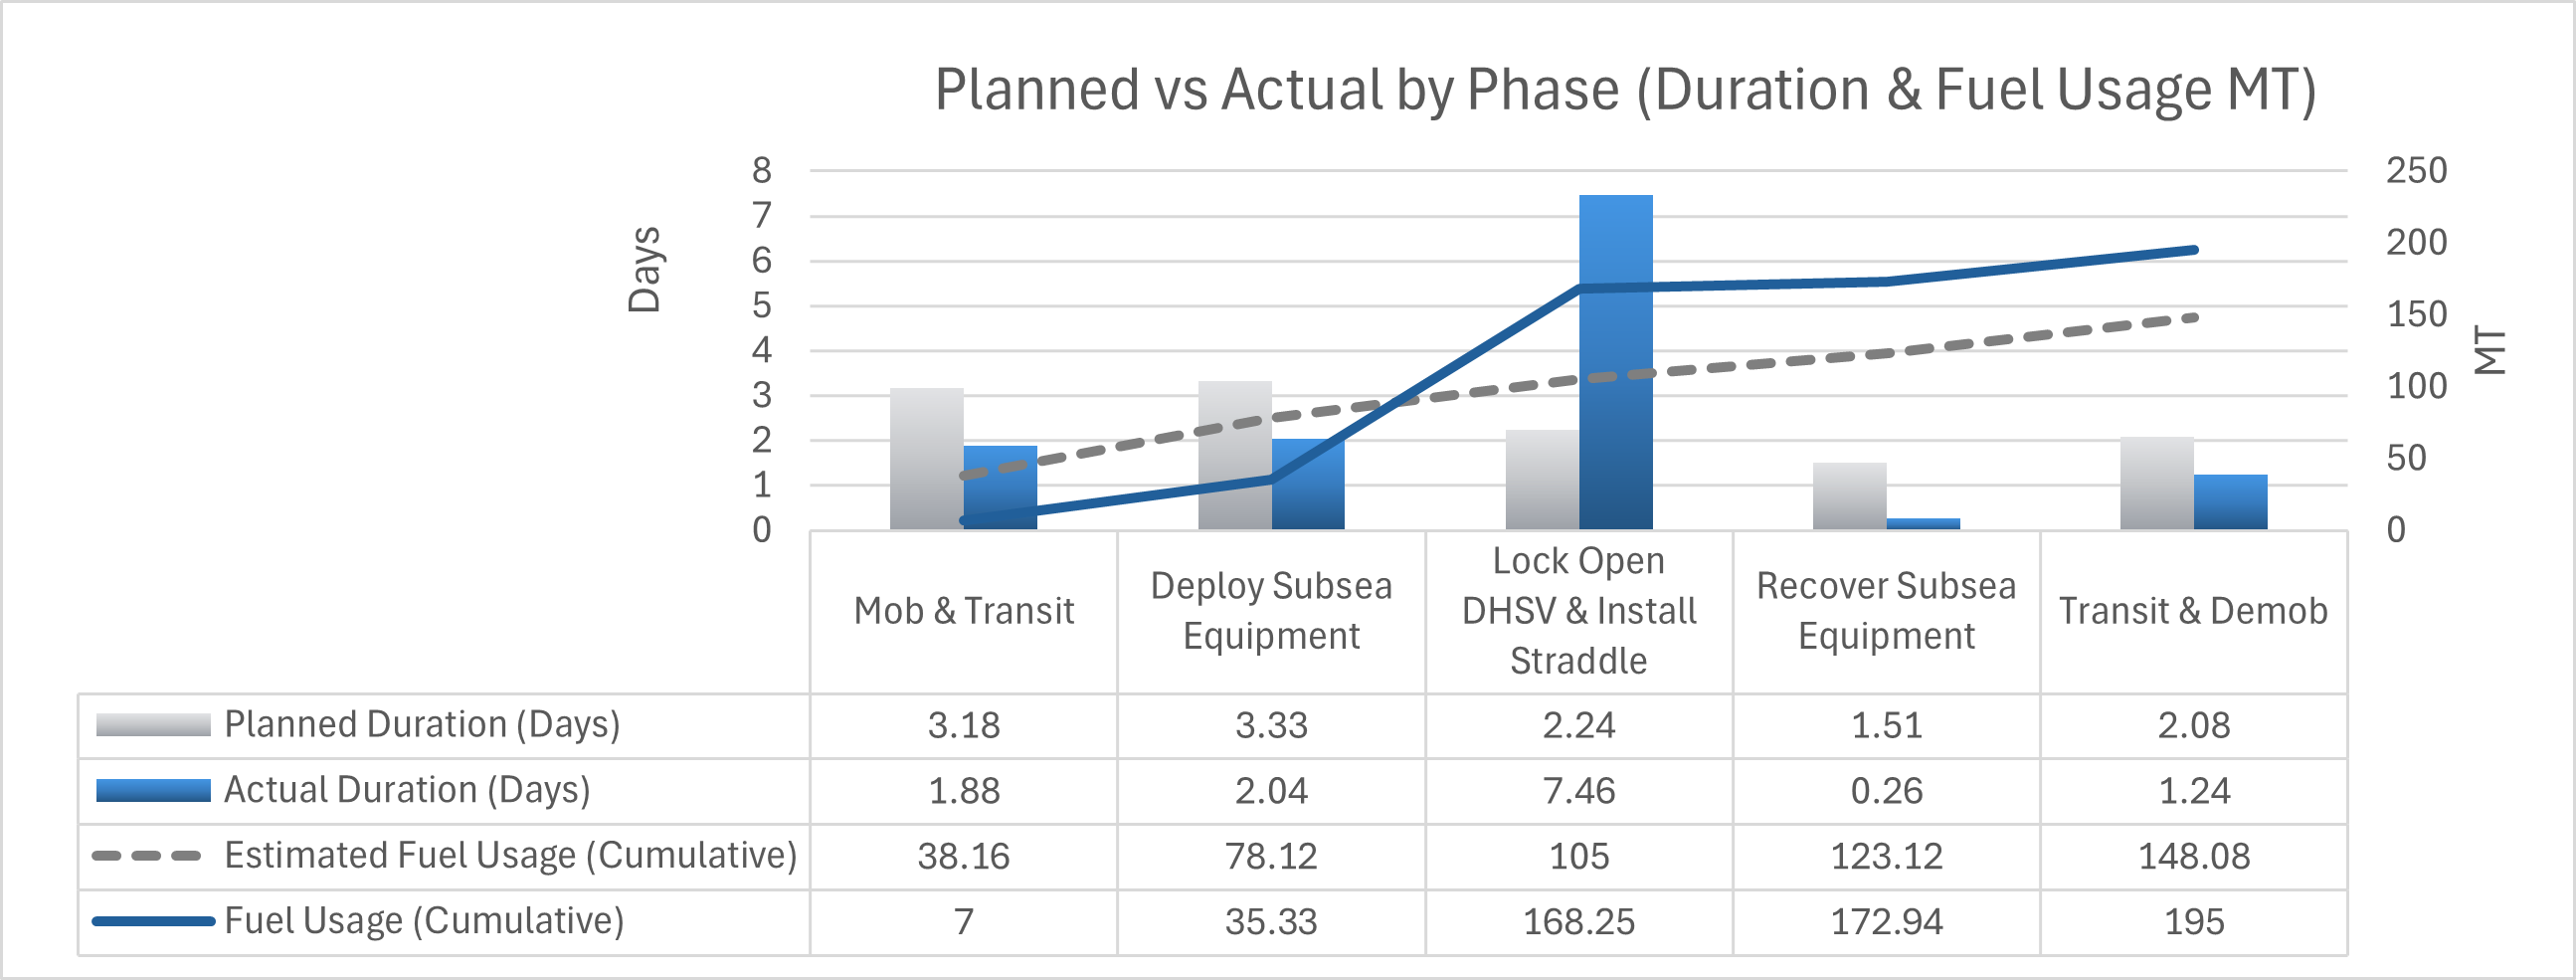
This would be a fantastic improvement. I have so many use cases for this e.g. compared planned vs actual values.
This is an example of the type of things I need to produce:
1 Like