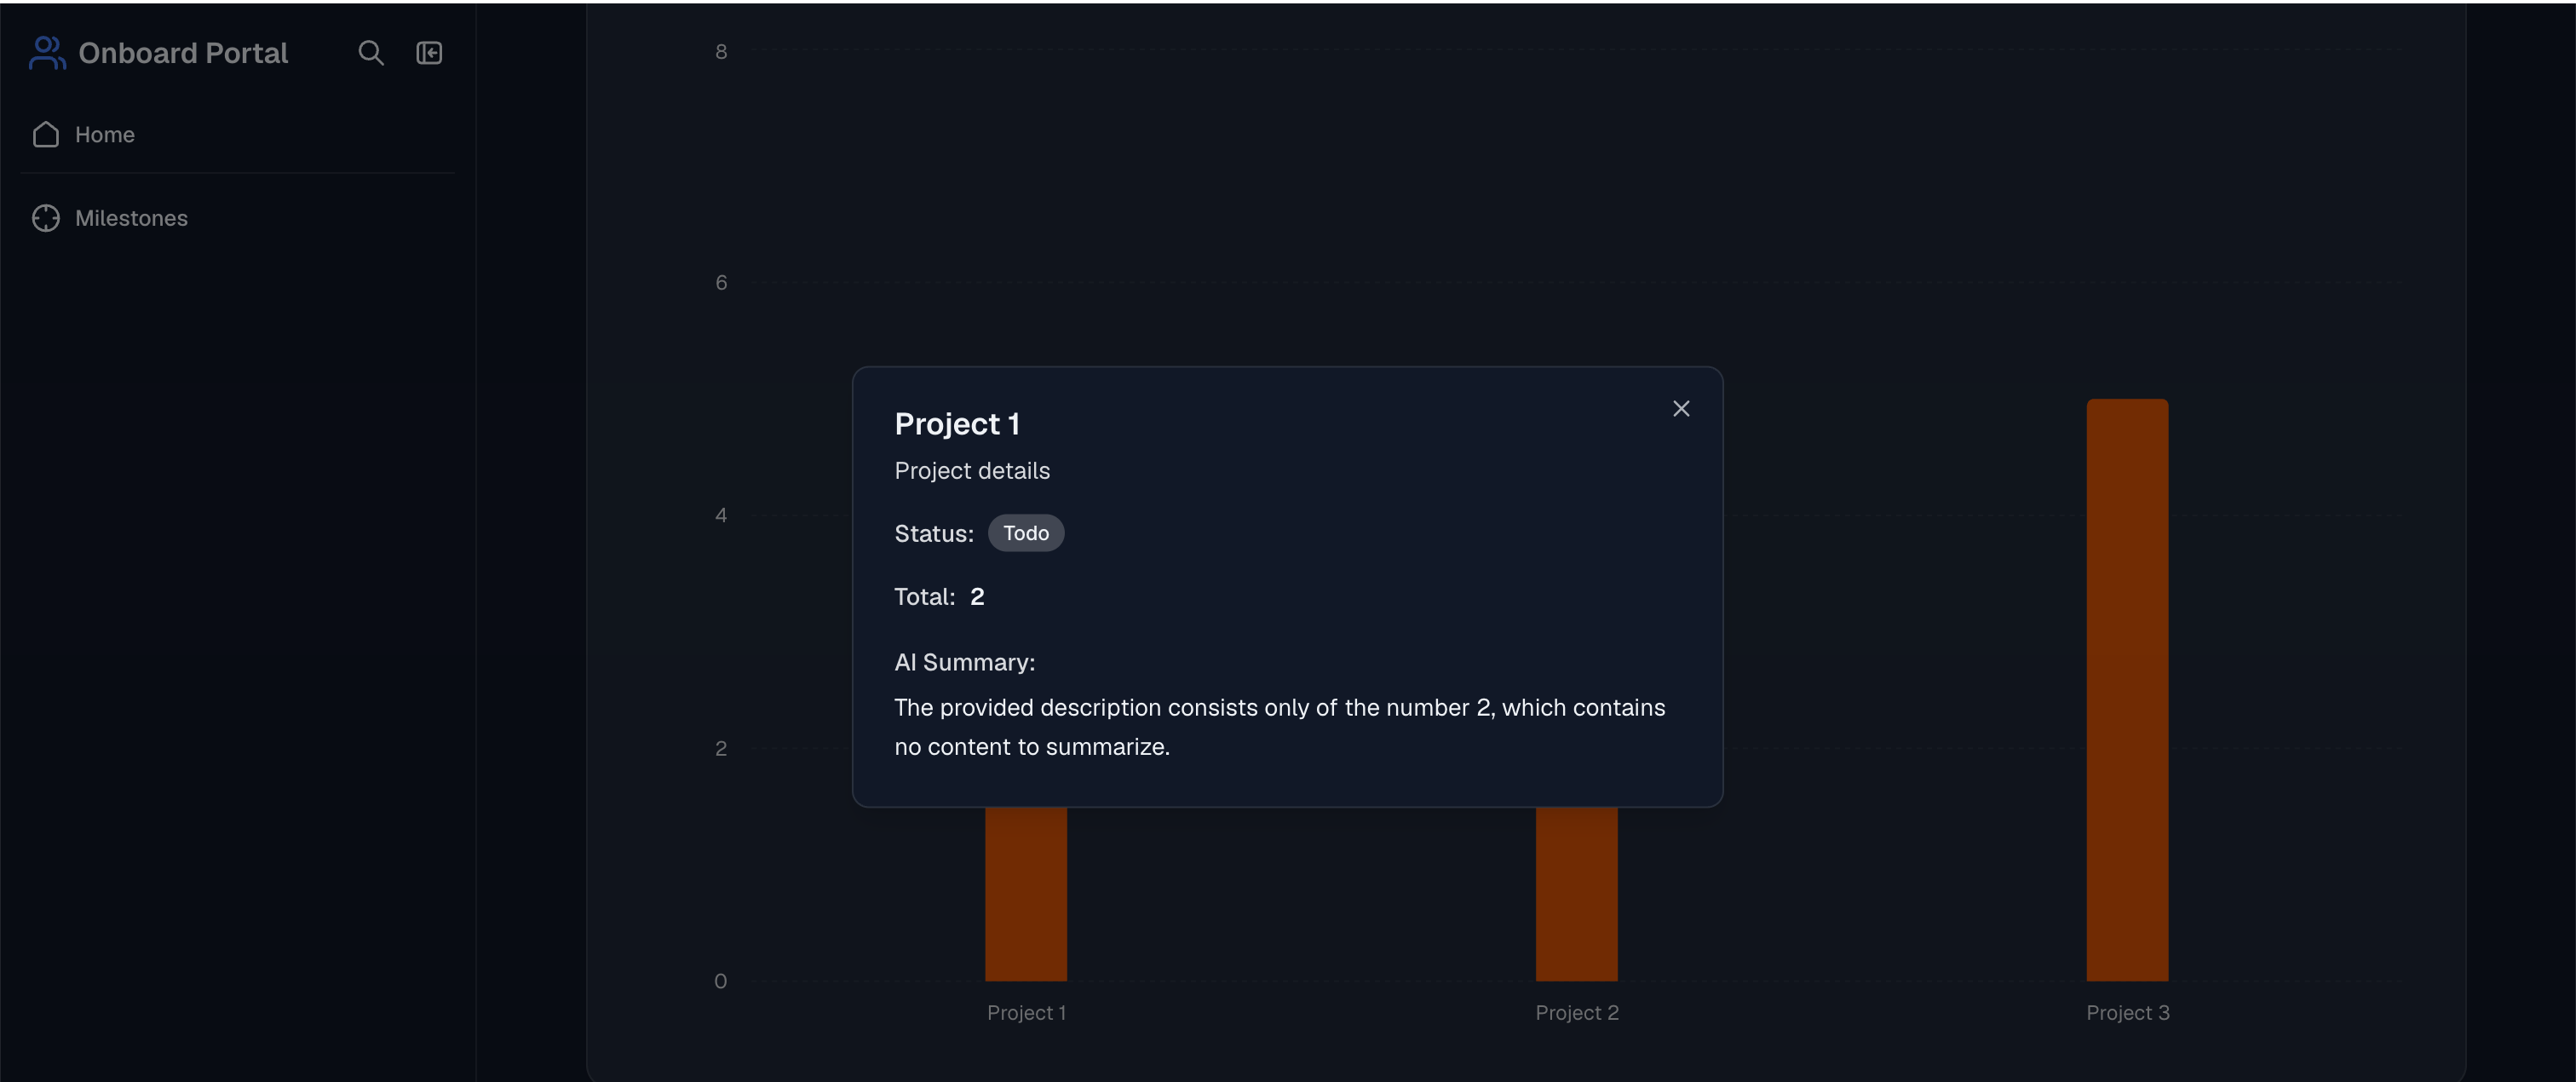
Description:
Currently, Softr charts (e.g., Metric, Bar, Line) display summary data such as the number of quotes pending confirmation. While these metrics are visually useful, there is no direct way to click on a chart value and see the underlying associated records.
Feature Request:
Add an option in Softr’s chart settings to make charts clickable. When a user clicks on a chart or metric, they should be taken to:
A pre-filtered list view of the associated records in Softr, or
A linked page with those records displayed based on the chart’s data filter.
Use Case Example:
A Metric chart showing `# of quotes pending your confirmation: 16
When clicked, it opens a table/list view filtered to show those 16 specific quote records, enabling the user to review and take action immediately without manually searching.
Benefits:
Improves navigation efficiency.
Reduces time spent finding related records.
Makes charts interactive and actionable, not just visual summaries.
Additional Considerations:
Should support all chart types (Metric, Bar, Pie, etc.).
Allow admins to choose whether clicking opens a Softr list view, a linked page, or triggers a URL/action.
Maintain existing chart styling and functionality while adding the interactivity option.
This feature would be incredibly valuable. In Airtable, it’s one of the strongest tools for turning data into real insights. I really like Softr, but this is currently the main reason I can’t fully consider it as an alternative to Airtable yet.
Thanks for the details — this is a solid and well-thought-out use case.
Yes, this is technically doable. Making charts clickable and linking them to pre-filtered record views or pages is feasible from an implementation perspective.
That said, this would require product-level design decisions around configuration (chart types, target actions, permissions, and filtering logic) to ensure it works consistently across use cases without adding complexity to the chart experience.
We’ll log this as a feature request and evaluate it alongside similar navigation and data-interaction improvements, as it clearly adds value by making charts more actionable rather than purely visual.
Yeah another thing Airtable does really well and why we use internally. Be great if Softr could implement so our external users could use benefit from these value add features too.
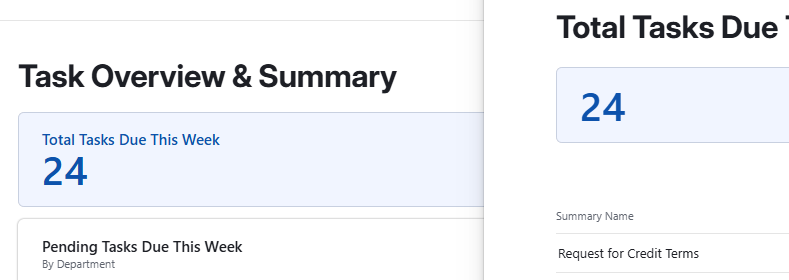
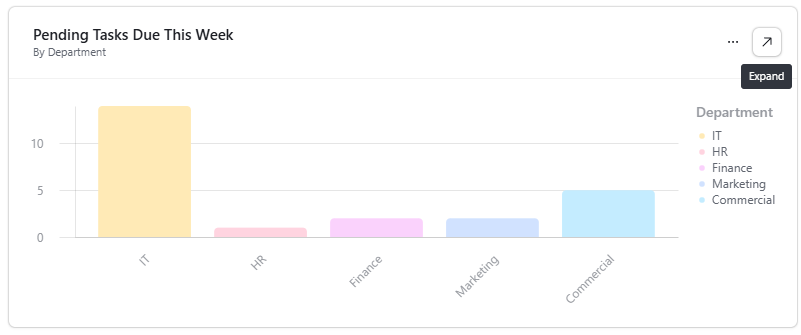
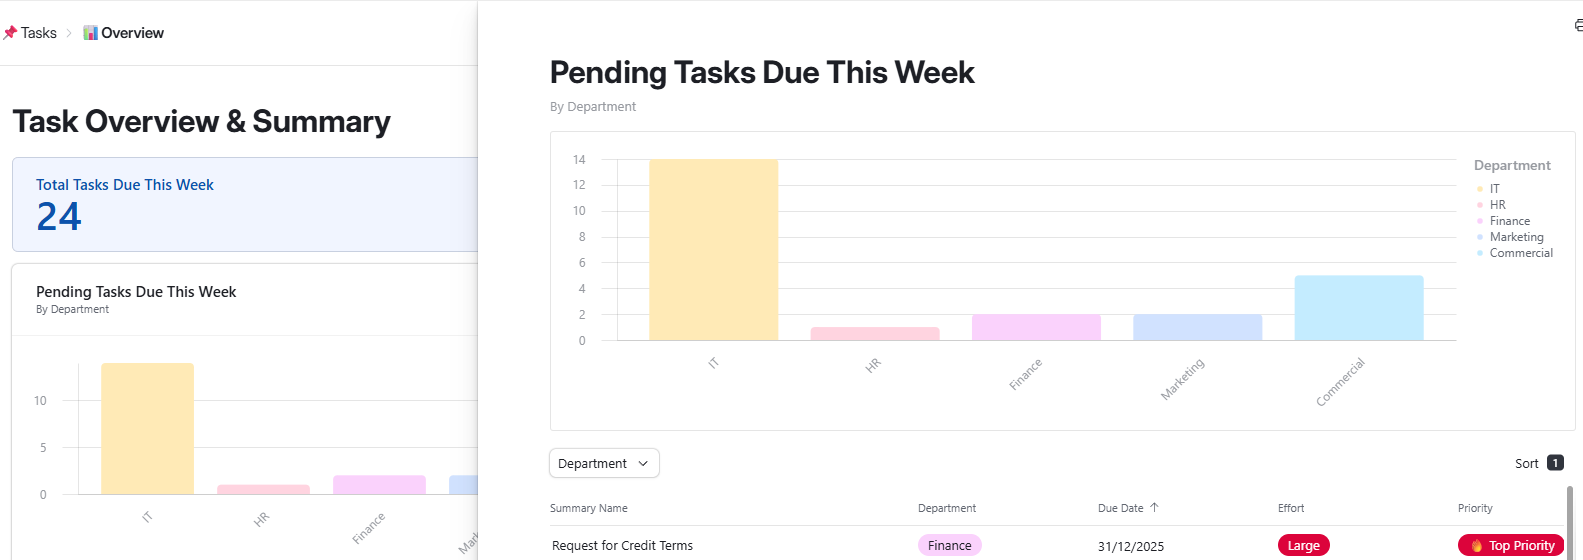
Hey @Andranik how is progress going on this? See below examples how Airtable allows you to expand the graphs into the underlying records across all graphs/charts etc @GuillaumeDuv Copying you in here too. Can we make this native as the AI Vibe code doesnt work across multiple tables so end up having too much variations occuring
+1 for this feature, I’m surprised it is not live yet!
As Teun said: this is a major issue when considering moving from Airtable interfaces to Softr for many of my clients.
I realize this is from a while ago, but I’m curious if there have been any updates on this feature request? It seems crucial for many users, and I think having a progress update or timeline would be beneficial. Softr should definitely prioritize this to stay competitive!
I came across this older discussion and wanted to add: Any updates on whether this feature has been implemented? It sounds like a fantastic way to enhance user interaction. If not, maybe we can brainstorm some workarounds? I’m curious about everyone else’s workflow and how you’re currently dealing with viewing underlying records from Softr charts.
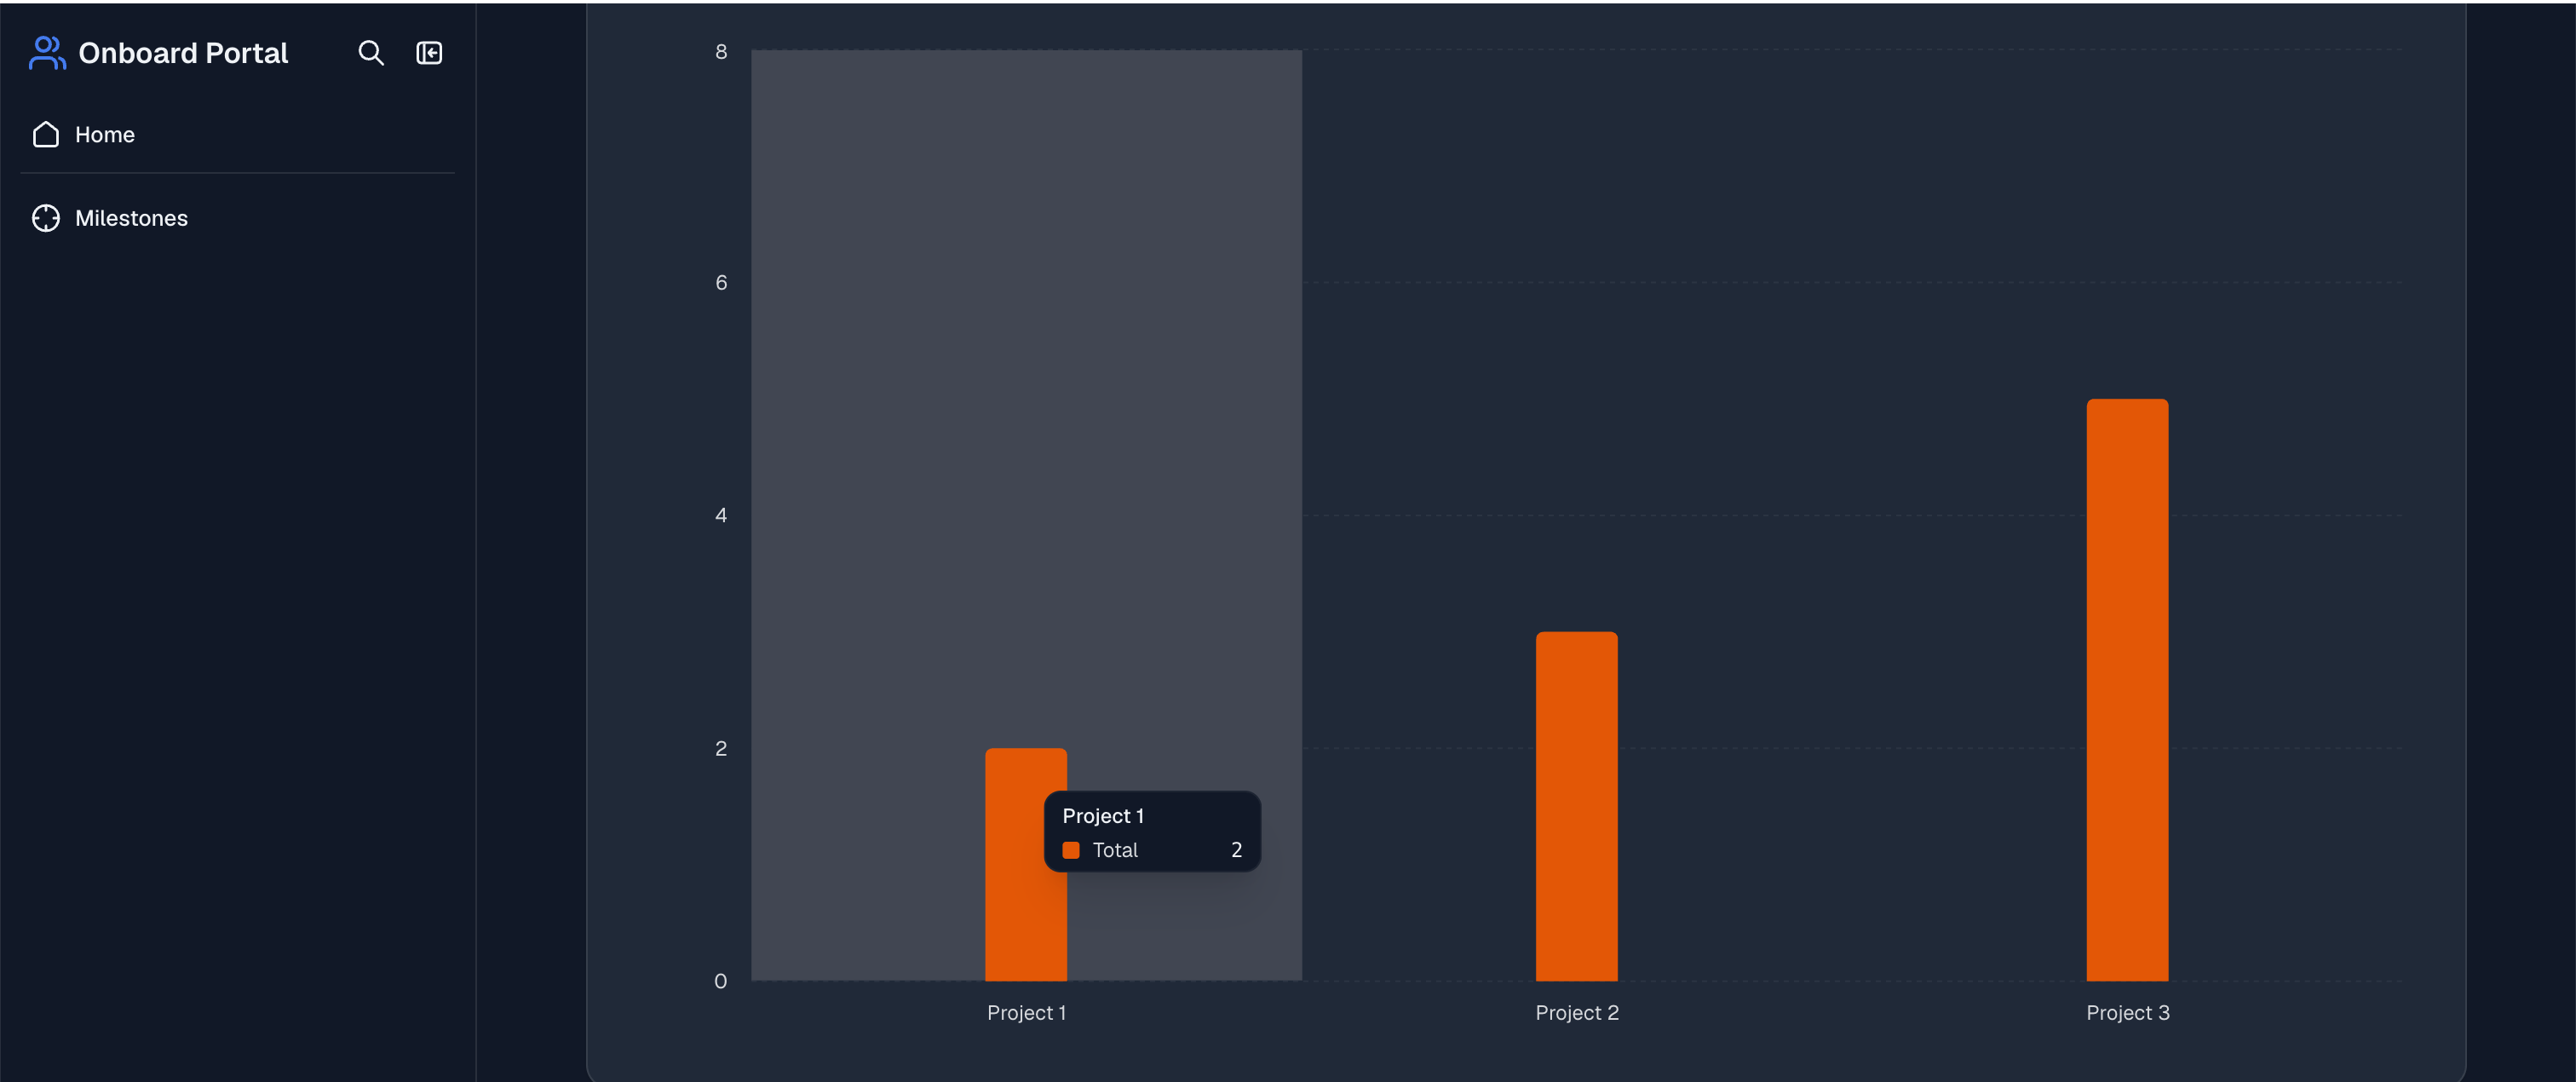
Thanks a lot for reigniting this thread @jiroceqa a workaround that you can consider is to use the Vibe AI coding block to receive a similar outcome, here I tried to demonstrate it in the screenshots.
For me this is one of the features that SOFTR needs that would make migration from Airtable to SOFTR a definte option. And then not using vibe coding as only alternative